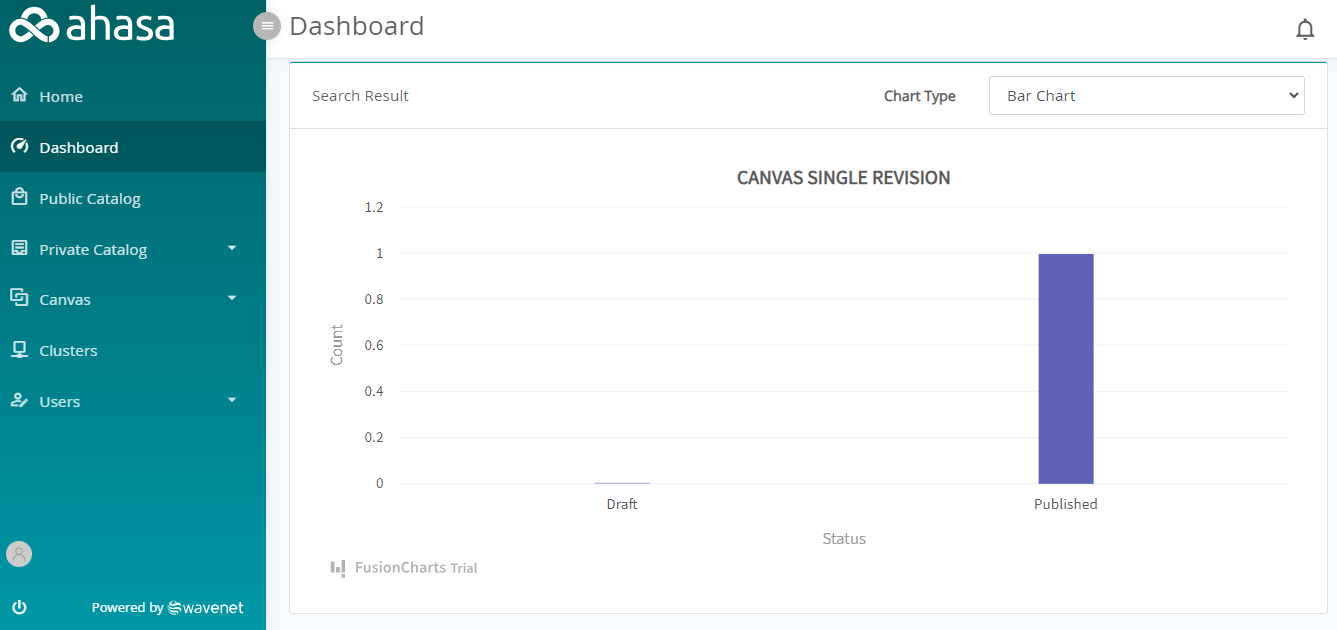
The dashboard can be used to view charts on selected criteria. For example, you can view the number of canvasses that were revised only once in a selected period.
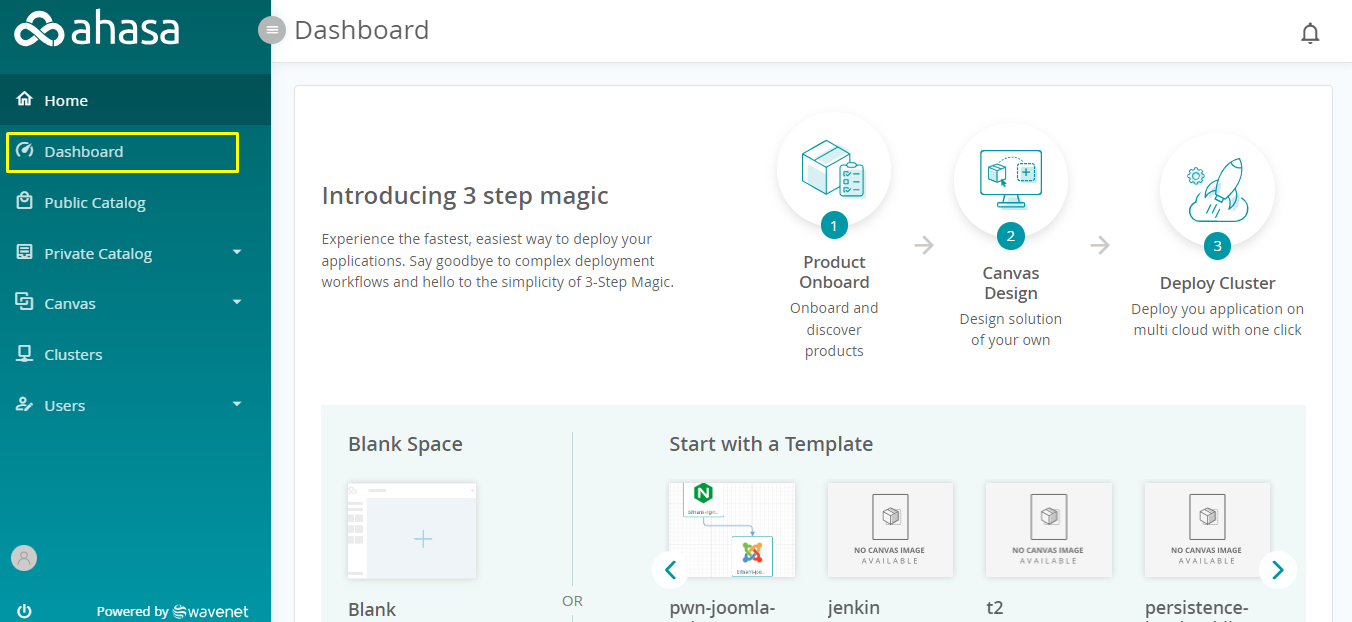
1. Login to Ahasa.
2. On the Left Pane click Dashboard.
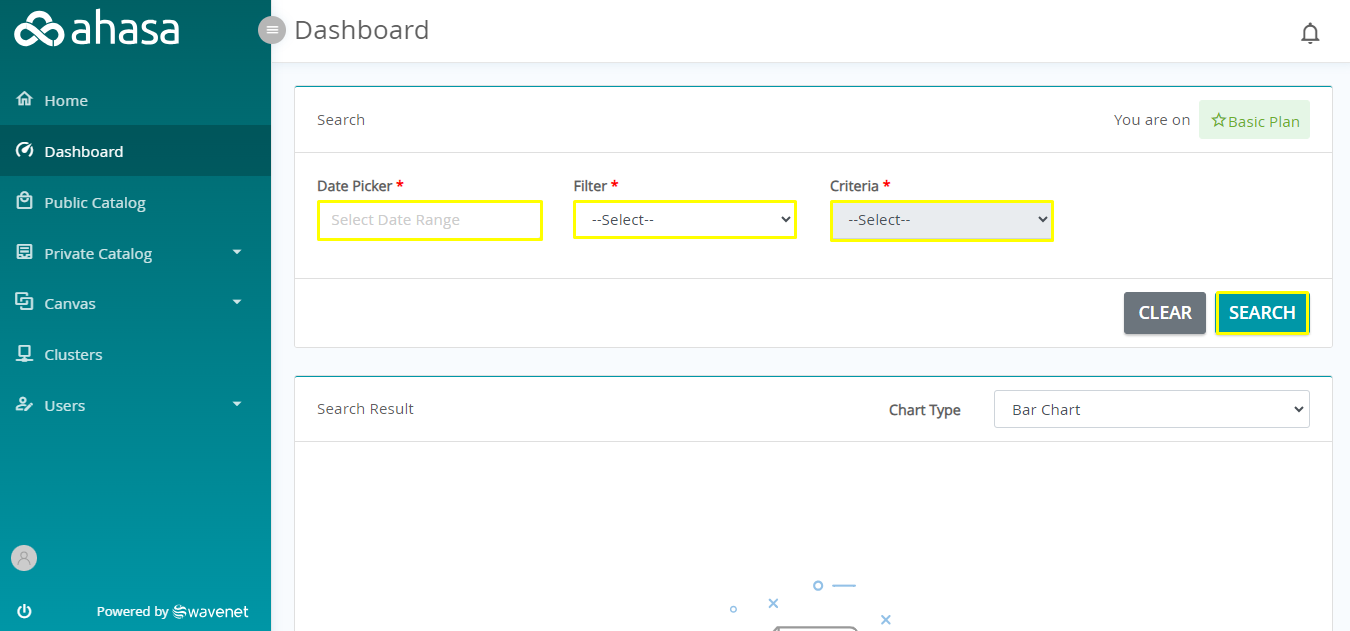
3. Pick your required Date Range, the Filter (Category of the operation), and the Criteria. Criteria changes according to the Filter. Then click Search to view the information.
4. Use the Chart Type to change the visualization.